System stats, simplified.
AdsumStats lives quietly in your menu bar, giving you instant visibility into your Mac's performance without draining its battery.
Two Versions, Different Capabilities
App Store Version
Recommended for most users
- ✓ Easy Installation: Install directly from the App Store
- ✓ Automatic Updates: Stay current with new features
- ✓ Security: Sandboxed environment for maximum safety
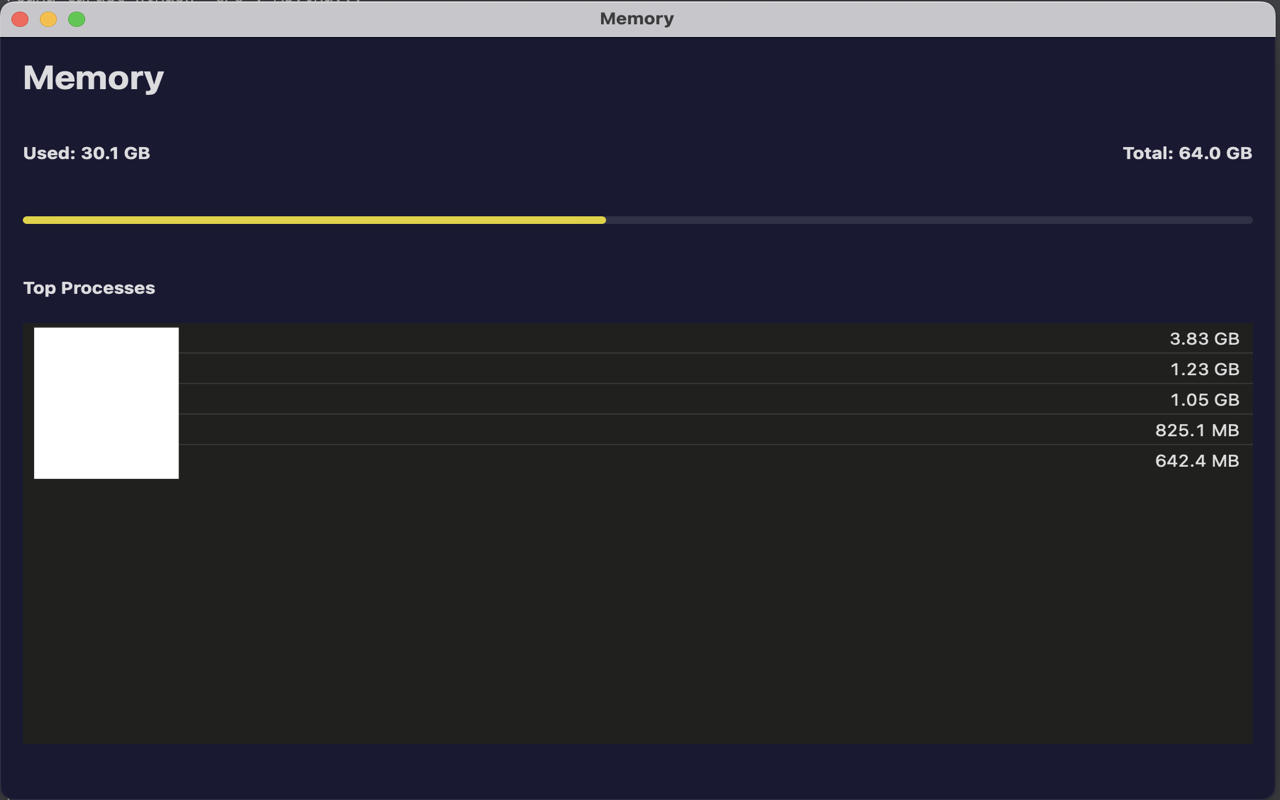
- ✗ Memory Monitoring: Limited to single process memory
Direct Download Version
For power users
- ✓ Full Memory Monitoring: Tracks total system memory usage
- ✓ No App Store Required: Install directly from our website
- ✓ Complete Features: All monitoring capabilities enabled
- ⚠ Manual Updates: You'll need to manually download updates
The direct download version is recommended for users who need full system memory monitoring capabilities.
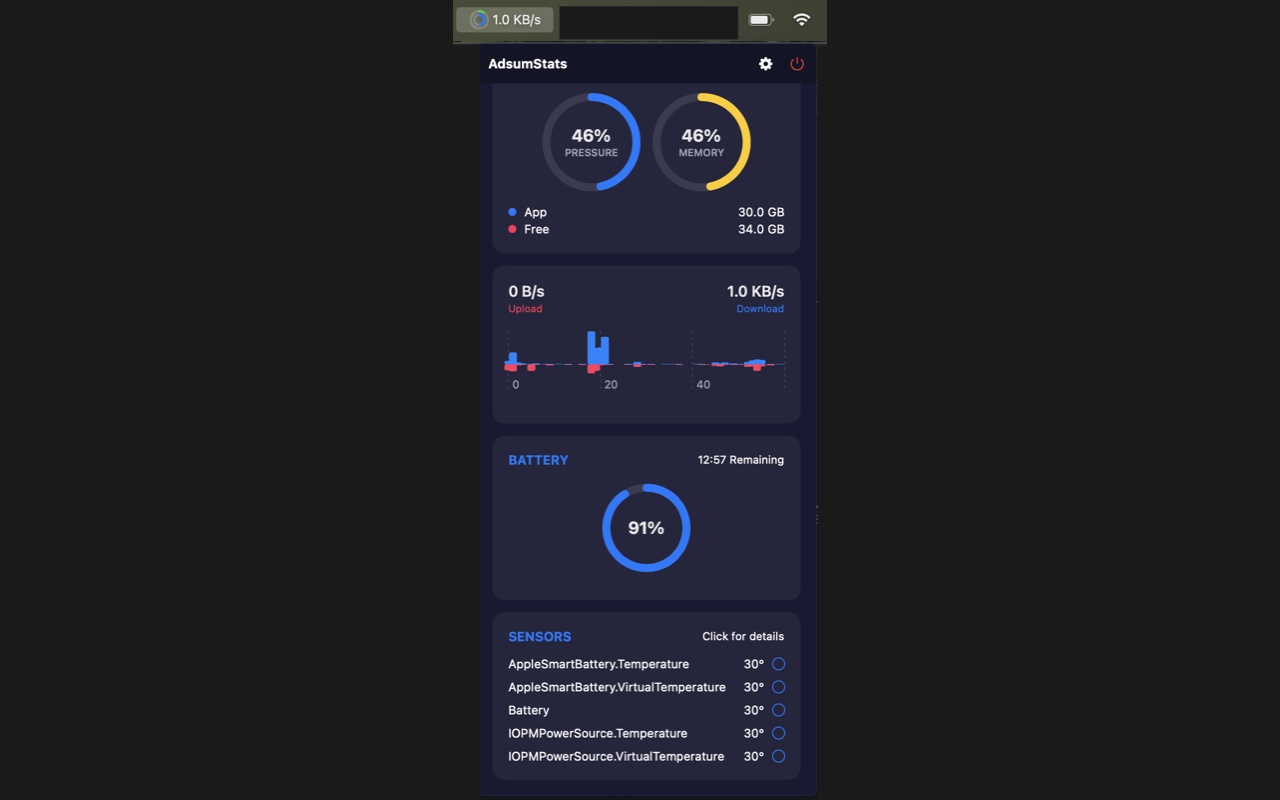
Download Direct VersionGlanceable Gauges
Compact circular gauges show CPU and Memory usage right in your menu bar. No need to click to know if you're maxing out.
Battery Health
Track energy impact per app and get accurate time-remaining estimates based on your real-time usage.
Apple Silicon Ready
Optimized for M1/M2/M3/M4 chips. Tracks specific GPU load and Neural Engine activity with zero overhead.
Detailed Analytics
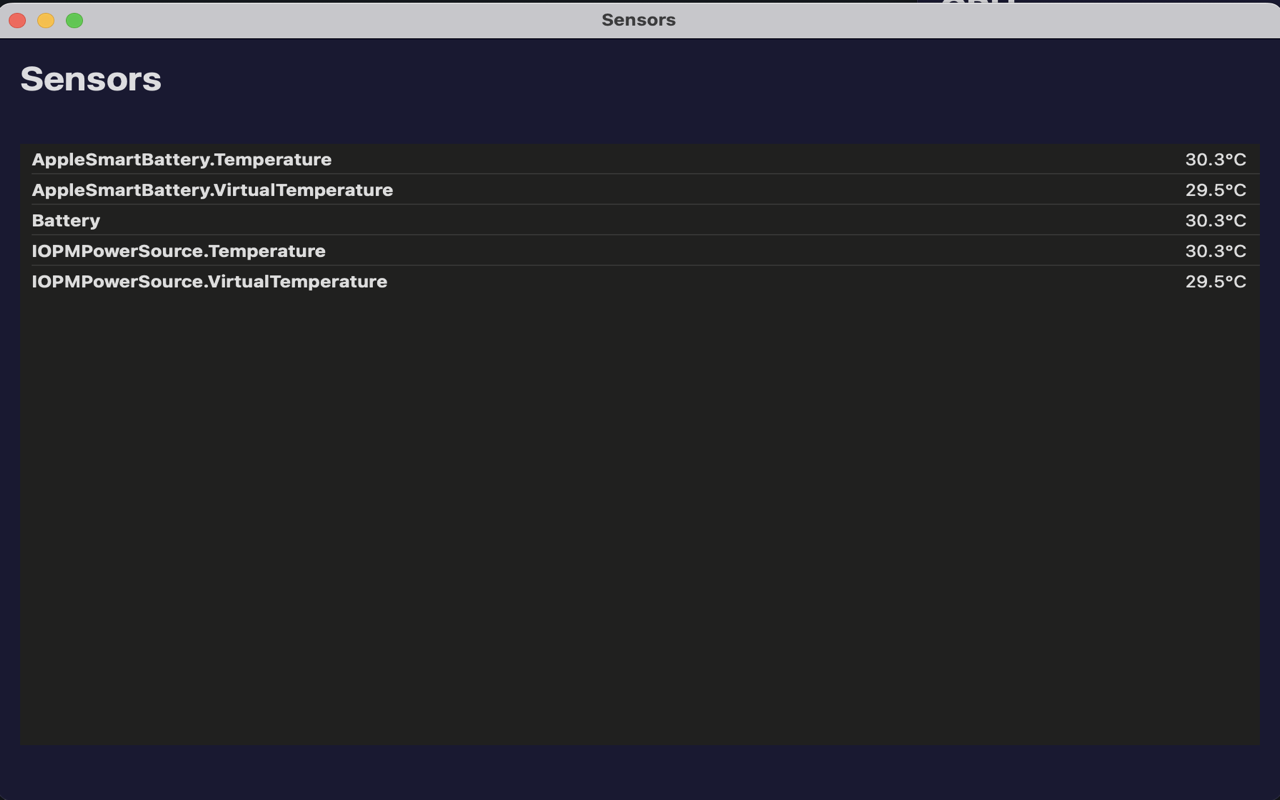
Click the menu icon to reveal the full dashboard. Monitor network throughput, thermal pressure, and detailed process breakdowns.
- ● Process Hogs: Identify exactly which app is spinning the fans.
- ● Network Graph: Visualize upload/download spikes in real-time.
- ● Memory Pressure: Understand if you really need that 32GB upgrade.
Safety First Architecture
Runs in a strictly confined environment. Cannot access personal files or modify system settings.
All monitoring happens locally. No analytics, no tracking, and no data ever leaves your Mac.
Built on stable, documented Apple frameworks (MetricKit, IOKit) for maximum stability.
A tiny ~5MB binary. No Electron, no web views, just pure performance.